
時系列データの扱い方
この講義では、時系列データ処理について学習します。
時系列データとは時間を軸に記録されたデータの集まりで
株価のデータや気温、湿度などの気象データなどです。
Pandasでは、データフレームのindexを日付型にすることで
時系列データとして扱えるようになるそうです。
講義を進めるにあたって、キノコードさんのサイトで
あるアパレル会社の販売データとしてサンプルデータ
をご用意されています。
jupyternotbookを保存している同じフォルダに
ダウンロードしておきます。
下記がキノコードさんのサイトのデータです。
sample.csvファイル_click
sample02.csvファイル_click
まずはいつも通りpandasをインポートして
データフレームの表示領域を設定します。
そしてread_csvでsample.csvを読み込みます。
1行目に項目の行があるので、これをカラム名として読み込めるよう、引数headerに0を指定します。
前情報として二つのサンプルデータは下記となります。
sample.csv
実績管理表でスタッフごとに
何をいくら売り上げたのかがわかります。
時系列データが0000/00/00 という形です。
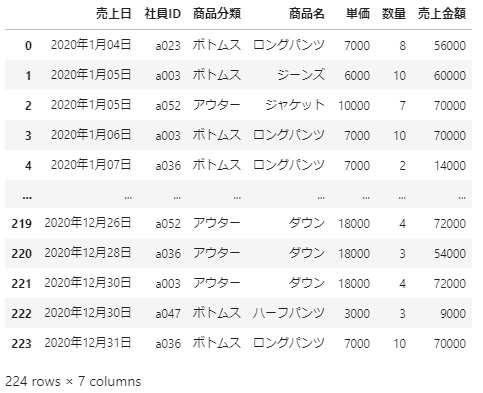
sample02.csv
同じく実績管理表です。
時系列データが 00年00月00日という形です。
import pandas as pd
pd.options.display.max_rows = 10
pd.options.display.max_columns = None
df = pd.read_csv('sample.csv', encoding='shift-jis' ,header=[0])
df
csvデータが文字コード問題で読み込めない‼
と入力したのですが、
エラーが出て読み込めませんでした。
UnicodeDecodeError: 'shift_jis' codec can't decode byte 0x86 in position 21: illegal multibyte sequenceなんのことかさっぱりわからないのですが、
このままのエラー文章で検索してみたら
解決策らしいのが出てきました。
文字コードを変えればいいみたいで、データの中の
名前に使われている漢字によってはエラーが出てしまうみたいです。
encoding='shift-jis' の所を encoding='cp932'
に変えて実行。
するとまたまたエラー(笑)
UnicodeDecodeError: 'cp932' codec can't decode byte 0x86 in position 21: illegal multibyte sequence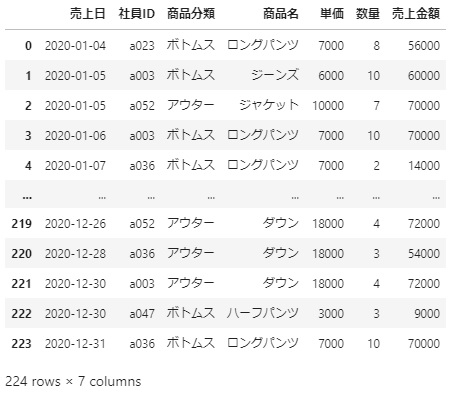
エラー文が出たら、そのままをGoogleで検索すると
なんとかなるみたいです。
info()メソッドを使ってデータの概要をつかみます。
df.info()
<class 'pandas.core.frame.DataFrame'>
RangeIndex: 224 entries, 0 to 223
Data columns (total 7 columns):
 #   Column  Non-Null Count  Dtype
---  ------  --------------  -----
 0   売上日     224 non-null    object
 1   社員ID    224 non-null    object
 2   商品分類    224 non-null    object
 3   商品名     224 non-null    object
 4   単価      224 non-null    int64
 5   数量      224 non-null    int64
 6   売上金額    224 non-null    int64
dtypes: int64(3), object(4)
memory usage: 12.4+ KB
時系列データへの変換
0 売上日 224 non-null object
売り上日の列が文字列になっているので、日時型に変換します
df['売上日'] = pd.to_datetime(df['売上日'])
df['売上日']
0     2020-01-04
1     2020-01-05
2     2020-01-05
3     2020-01-06
4     2020-01-07
         ...
219   2020-12-26
220   2020-12-28
221   2020-12-30
222   2020-12-30
223   2020-12-31
Name: 売上日, Length: 224, dtype: datetime64[ns]
売り上げ日をindexに変換
すでにあるカラムをindexに指定します。
set_indexメソッドを使います。
df_2 = df.set_index('売上日')
df_2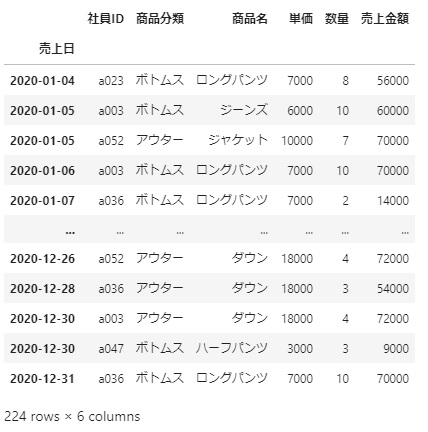
info()でデータを確認します。
DatetimeIndex: 224 entries, 2020-01-04 to 2020-12-31
ちゃんと日付がindexになっています。
df_2.info()
<class 'pandas.core.frame.DataFrame'>
DatetimeIndex: 224 entries, 2020-01-04 to 2020-12-31
Data columns (total 6 columns):
 #   Column  Non-Null Count  Dtype
---  ------  --------------  -----
 0   社員ID    224 non-null    object
 1   商品分類    224 non-null    object
 2   商品名     224 non-null    object
 3   単価      224 non-null    int64
 4   数量      224 non-null    int64
 5   売上金額    224 non-null    int64
dtypes: int64(3), object(3)
memory usage: 12.2+ KB
次にsamle2.csvも読み込んでみます。
だめもとで、キノコードさんと同じコードを入力しましたが、
df02 = pd.read_csv('sample02.csv', encoding='shift-jis',header=[0])
df02
UnicodeDecodeError: 'shift_jis' codec can't decode byte 0x86 in position 21: illegal multibyte sequenceやはりエラーでした(笑)
なのでsample.csvの時と同様にencoding='utf-8'でやってみます。
今回も何故成功したのかは、詳細は謎です(笑)
前回同様、情報を見てみます。
df02.info()
<class 'pandas.core.frame.DataFrame'>
RangeIndex: 224 entries, 0 to 223
Data columns (total 7 columns):
 #   Column  Non-Null Count  Dtype
---  ------  --------------  -----
 0   売上日     224 non-null    object
 1   社員ID    224 non-null    object
 2   商品分類    224 non-null    object
 3   商品名     224 non-null    object
 4   単価      224 non-null    int64
 5   数量      224 non-null    int64
 6   売上金額    224 non-null    int64
dtypes: int64(3), object(4)
memory usage: 12.4+ KB
で、前回同様にdetetimeをつかって日時を変換してみます。
df02['売上日'] = pd.to_datetime(df02['売上日'])

ParserError: Unknown string format: 2020年1月04日
年月日を時系列データへ変換
このような場合は、
formatで日付の形式を記述することで
変換できるみたいです。
df02['売上日'] = pd.to_datetime(df02['売上日'], format='%Y年%m月%d日')
df02['売上日']
0     2020-01-04
1     2020-01-05
2     2020-01-05
3     2020-01-06
4     2020-01-07
         ...
219   2020-12-26
220   2020-12-28
221   2020-12-30
222   2020-12-30
223   2020-12-31
Name: 売上日, Length: 224, dtype: datetime64[ns]
無事変換できました。
前回同様、時系列データをindexに変換します。
df = pd.read_csv('sample.csv', encoding='utf-8', header=0, parse_dates=True,index_col='売上日')
df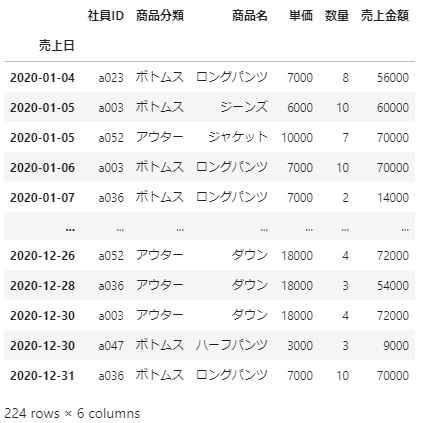
時系列データの抽出
試しに月を指定してデータを抽出してみます。
df_2['2020-08']
<ipython-input-28-3e93c1e943a7>:1: FutureWarning: Indexing a DataFrame with a datetimelike index using a single string to slice the rows, like `frame[string]`, is deprecated and will be removed in a future version. Use `frame.loc[string]` instead.
  df_2['2020-08']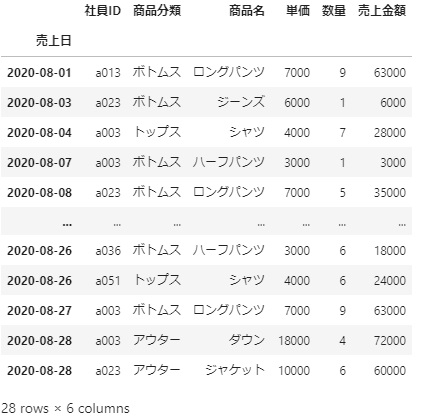
なんかエラーっぽいのが出てますが、とりあえず
データの抽出はできたのでよしとします(笑)
その他、日付を範囲指定してもデータを抽出できます。
df_2['2020-08-15':'2020-09-14']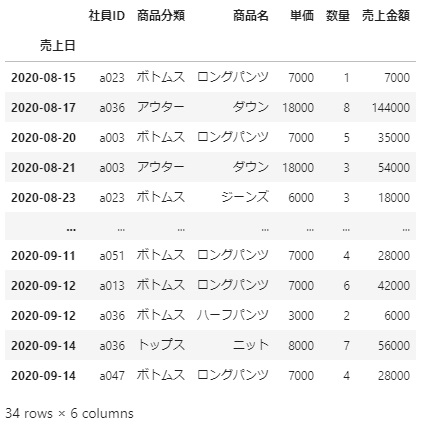
時系列データの集計
次は期間ごとの売り上げ集計の方法を学びます。
まずは売上金額と日付だけのデータを作成します。
期間ごとの集約には、resampleメソッドを使うそうです。
月ごとの集計をしたい場合は
括弧のなかにMを記述します。
df_3 = df['売上金額']
df_3.resample('M')
<pandas.core.resample.DatetimeIndexResampler object at 0x0000025F9E4F3B50>
この段階ではオブジェクトが作成されただけなので
実際の出力を得るにはsum や mean などの計算の関数が必要です。
#月毎の売り上げ
df_3.resample('M').sum()
売上日
2020-01-31 742000
2020-02-29 517000
2020-03-31 625000
2020-04-30 511000
2020-05-31 555000
...
2020-08-31 1395000
2020-09-30 800000
2020-10-31 589000
2020-11-30 1252000
2020-12-31 852000
Freq: M, Name: 売上金額, Length: 12, dtype: int64
#四半期ごとの売り上げ
df_3.resample('Q').sum()
売上日
2020-03-31 1884000
2020-06-30 2024000
2020-09-30 3078000
2020-12-31 2693000
Freq: Q-DEC, Name: 売上金額, dtype: int64
#10日ごとの売り上げ
df_3.resample('10D').sum()
売上日
2020-01-04 526000
2020-01-14 95000
2020-01-24 149000
2020-02-03 212000
2020-02-13 263000
...
2020-11-19 409000
2020-11-29 159000
2020-12-09 362000
2020-12-19 291000
2020-12-29 151000
Freq: 10D, Name: 売上金額, Length: 37, dtype: int64おなじような感じで、月ごとの最大値、最小値、平均なども
算出可能です。
df_3.resample('M').mean()
df_3.resample('M').max()
df_3.resample('M').min()
さらにagg関数をつかって、リストで計算式を入れると
一気に計算することも可能です。
df_3.resample('Q').agg(['sum', 'mean', 'max', 'min'])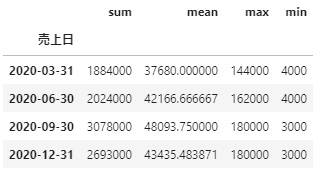
曜日ごとの集計
インデックスがdatetime64[ns]型になっているので、
インデックスのweekdayを参照することで、
曜日を0〜6の数値で取得できます。
説明文だけみてもよくわからないのでコードを入力して
実行してみます。
df_3.index.weekday
Int64Index([5, 6, 6, 0, 1, 3, 4, 5, 5, 5,
            ...
            1, 1, 4, 5, 5, 5, 0, 2, 2, 3],
           dtype='int64', name='売上日', length=224)
0が月曜日で、6が日曜日です。各日付の曜日番号が表示されています。
これをDataFrameの抽出条件に使うことで、
曜日によるデータ抽出が可能です。
月曜日のデータだけ抽出してみましょう。
月曜日は0なので、weekdayが0のデータを抽出します。
説明を聞いてもピンとこないので、実行してみます。
df_3[df_3.index.weekday == 0].mean()
48969.69696969697
最後の曜日のとろこはいまいち理解できませんでしたが、
日付のデータを時系列データに変換してからデータの抽出をする
やりかたはなんとか理解できました。
また、read_csvについてもとても勉強になりました(笑)


コメント